Knowledge base ROI is the easiest line item to defend in a CX budget and the hardest one to write a believable number into. The percentages are everywhere. Companies see 23% higher CSAT. Deflection rates of 30 to 50%. Resolution times cut in half. The problem is that none of those numbers tell a CFO what the help center is worth in dollars at your company size. This article does the conversion.
Below are 25 statistics on knowledge base ROI from seven named sources, grouped by Deflection, Cost Savings, Agent Productivity, CSAT, and Time-to-Resolution. Each section ends with an explicit dollar conversion at a stated 100-employee SaaS baseline. The final two sections give the ROI formula and a 3-year scenario you can lift straight into a budget deck.
What is the ROI of a knowledge base in 2026?
A mature knowledge base at the typical 100-employee SaaS profile returns roughly 2 to 3x by the end of year two, with most of the return coming from ticket deflection and the rest from agent productivity and reduced churn. Year one is usually slightly negative because of setup, content production, and the lag between launching the help center and customers actually finding it.
The headline ROI number you see quoted in vendor decks (4x, 6x, 10x) is almost always a peak-year figure, not a multi-year average. The honest multi-year ROI lives in the 2 to 4x band for companies that staff the help center properly and refresh content as the product changes. Companies that ship a help center and let it rot end up with a negative ROI by year two because stale content drives customers back to tickets at a higher cost per resolution than if the help center never existed.
The methodology in this article is straightforward. Twenty-five statistics from seven sources, every percentage converted to dollars at a stated 100-employee SaaS baseline, a formula at the end so you can swap in your own numbers, and a 3-year scenario table.
The 100-employee SaaS baseline used in this article
Every dollar figure below uses the same baseline so the math is comparable across sections. The profile is a B2B SaaS company at 100 employees, the size where a help center investment usually becomes a board-level conversation.
Annual support cost at this baseline: 3,000 tickets x $15 x 12 = $540,000 per year just to answer questions through the ticket queue, before any help center is in place. That number is the denominator for every percentage in the rest of this article.
Deflection: how much of the ticket queue does a KB absorb (5 stats)
Deflection is the most direct ROI lever. Every question answered by a help center article is a ticket that never enters the queue. The range across published research is wide because the inputs (article quality, search experience, product complexity, customer skill) vary across companies.
- 30 to 50% of incoming support questions can be deflected to a well-maintained knowledge base. At the 100-employee baseline, the midpoint (40%) absorbs 1,200 tickets per month, saving $216,000 per year in direct ticket cost. (Forrester, customer service research)
- 67% of customers prefer self-service over speaking to a company representative. The preference is the demand signal. If two-thirds of your customers want self-service and you do not give them a working option, you are forcing the expensive channel on them. (Zendesk Customer Experience Trends)
- 91% of customers would use an online knowledge base if it were available and tailored to their needs. The "tailored" qualifier matters. A generic KB lifted from a vendor template does not hit 91% usage. Article-to-product fit is the determinant. (HDI, Help Desk Institute)
- 73% of customers want the ability to solve product or service issues on their own. Self-service is not a cost-cutting compromise from the customer's side, it is the preferred channel for routine work. (Aberdeen Group)
- 40% deflection is the median outcome for a well-maintained KB at SaaS scale; 60% is the top decile. The gap between median and top decile is mostly content freshness, search experience, and in-product surfacing. (Aggregate across multiple support analyst reports)
Dollar conversion at baseline. A median 40% deflection rate cuts the monthly ticket load from 3,000 to 1,800, saving $216,000 per year. A top-decile 60% deflection rate cuts it to 1,200, saving $324,000 per year. The delta between median and top-decile execution at this baseline is over six figures annually, which is roughly the cost of the content team needed to reach the top decile.
Cost savings: per-ticket economics (5 stats)
Per-ticket economics are the lever that makes the deflection number into a defensible dollar figure. The cost gap between self-service and human-handled support is roughly two orders of magnitude.
- $0.10 per self-service interaction vs $8 to $13 per live support interaction. The widest-cited industry benchmark. Self-service is roughly 80 to 130 times cheaper per resolved question. (SuperOffice Customer Service Benchmark Report)
- Live phone support averages $11 per contact; live chat averages $5; self-service averages under $1. The channel mix decision is a cost-multiplier decision. (BenchmarkPortal, contact-center cost surveys)
- Companies with mature knowledge bases reduce overall support cost per resolution by 33%. The reduction comes from channel shift, faster human-handled tickets (because agents have a KB to pull from), and lower escalation rates. (Aberdeen Group)
- Customer service operations spend 20 to 30% of their budget on repeat-question handling that a help center should absorb. The "should absorb" qualifier is doing real work in that sentence. Most help centers do not absorb this load because the content does not match the questions. (Forrester)
- The cost differential between deflected and human-handled tickets compounds over time as the help center matures. Year-one cost-per-resolution drops are typically 10 to 15%. Year-three drops reach 30 to 40% as content coverage and search quality improve. (KCS Practice Guide patterns)
Dollar conversion at baseline. Of the $540,000 annual ticket cost, a 40% deflection at $0.10 vs $15 per resolved question moves 14,400 questions per year from the $15 lane to the $0.10 lane. The cost of those 14,400 questions drops from $216,000 to $1,440. Net annual savings on the deflected portion alone is roughly $214,560.
Agent productivity: time saved through KB use (5 stats)
Productivity gains are the second ROI lever after deflection. Agents working with a current knowledge base resolve tickets faster, escalate fewer, and onboard quicker. The Knowledge-Centered Service (KCS) methodology is the most-cited source for these numbers.
- KCS practitioners see resolution times drop 25 to 50% in the first 3 to 9 months. The mechanism is agents drafting articles as part of the resolution flow, so each ticket leaves a reusable artifact behind. (Consortium for Service Innovation, KCS Library)
- Agent ramp time drops 30 to 50% with a mature internal knowledge base. New agents reach productivity faster because the answers exist in writing, not in tribal knowledge. (KCS Practice Guide v6)
- Each agent saves an estimated 4 to 6 hours per week through KB use during ticket handling. At 5 agents and the midpoint (5 hours), that is 25 hours per week of reclaimed time, roughly half a headcount of capacity. (HDI)
- First-call resolution rises 20 to 40% in environments with strong agent-facing KBs. Higher first-call resolution means fewer follow-ups, fewer escalations, and higher customer satisfaction in the same ticket. (SQM Group)
- Time to first response drops by 25 to 35% when agents have search-first access to a well-tagged KB. The reduction is mostly mechanical: agents stop hunting through Slack and Notion for the answer. (Help Scout, support team benchmark data)
Dollar conversion at baseline. Five agents at $75,000 per year is $375,000 in annual agent cost. A 25% productivity gain returns roughly $93,750 worth of capacity per year. The capacity rarely converts directly to headcount reduction (most teams reinvest it into higher-tier work), but it is real and accounted for in defensible budget models.
"The most successful customer-facing AI focuses on automating CRaP: Confident, Routine, Predictable."
Jeff Toister, Toister Performance Solutions
The same logic applies to knowledge base ROI without the AI layer. The productivity gain is largest on routine, predictable questions where a well-written article replaces a 7-minute ticket conversation with a 30-second search. Trying to push complex, judgment-heavy tickets through self-service is where ROI claims usually fall apart.
CSAT impact: how a good KB raises satisfaction (5 stats)
CSAT gains do not show up on a P&L directly. They show up downstream as retention, expansion, and word of mouth. The conversion from CSAT lift to dollars goes through the churn rate.
- Companies with mature knowledge bases see 23% higher CSAT than companies without. The lift is the combined effect of faster answers, fewer ticket escalations, and a working self-service option. (Aberdeen Group)
- Customers who resolve issues via self-service report 12 to 18% higher CSAT than customers who use live channels for the same issue type. Counter-intuitive at first read, but the explanation is simple: self-service is faster for routine questions, and speed is the dominant CSAT driver for routine work. (Forrester)
- A 5 percentage point CSAT improvement correlates with a 1 to 2 percentage point reduction in churn at SaaS companies. The relationship is not linear at the extremes, but the middle of the curve holds. (Bain & Company, NPS-to-retention research)
- 33% of customers say a poor support experience is the most likely reason they would switch providers. CSAT is not a vanity metric. It is a leading indicator of switching intent. (Microsoft State of Global Customer Service)
- Knowledge-base-led support reduces complaint escalations by 40 to 60%. Escalations are the most expensive CSAT events. Cutting them in half cuts the CSAT-drag cost in half. (HDI, escalation benchmarks)
Dollar conversion at baseline. 50,000 customers at $5,000 average LTV is $250M in contracted lifetime value. A 1 percentage point churn reduction protects roughly $2.5M per year, the largest single line in the entire ROI model and the reason CFOs care about CSAT at all. Even at a 0.5 point churn reduction attributable to the help center alone, the retained value is over $1M.
Time-to-resolution: faster answers, fewer touches (5 stats)
Time-to-resolution is the rare metric that compounds in three directions at once: lower agent cost per ticket, higher CSAT, and lower escalation rates. The help center is the largest single lever on this metric.
- Self-service resolution averages 2 to 5 minutes vs 24 to 48 hours for email-channel resolution. Two orders of magnitude faster, and the speed gap is itself a CSAT driver. (Zendesk, response time benchmarks)
- Average handle time on agent-handled tickets drops 15 to 25% when agents reference a current KB during the conversation. Lower handle time directly converts to ticket capacity. (Help Scout)
- First-touch resolution improves 30 to 45% with a mature internal knowledge base, vs tribal-knowledge support teams. Most of the gap is structural, not skill-based. (KCS adoption data)
- Escalation rates from tier-1 to tier-2 drop 25 to 40% in KCS-mature support orgs. Tier-2 time is 3 to 5x more expensive than tier-1 time, so the escalation reduction is a disproportionately high-value line item. (Consortium for Service Innovation)
- Customer effort score (CES) drops measurably in the same ticket types covered by published help center articles. CES is the strongest predictor of repurchase intent in B2B SaaS, more predictive than NPS or CSAT in isolation. (Harvard Business Review, effortless service research)
Dollar conversion at baseline. A 20% drop in average handle time on the 1,800 monthly human-handled tickets (post-deflection) reclaims roughly 90 agent-hours per month. At a fully loaded agent rate of $36/hour, that is $38,880 per year in recovered capacity, on top of the deflection and productivity savings already counted.
The ROI calculation: turning percentages into dollars
The formula below is the one to put in front of a CFO. Every input is something a support lead already tracks. The output is annual savings attributable to the help center, before retention upside.
The formula:
Annual savings = (M x D x C x 12) + (A x H x R x 12)
Plug in the baseline: ((3,000 x 0.40 x $15 x 12) + (5 x 20 x $36 x 12)) = $216,000 + $43,200 = $259,200 per year in direct savings from a working help center at the 100-employee baseline. That number excludes retention upside (the LTV protection from CSAT lift), which can add $1M to $2.5M per year as a separate line item depending on how aggressively you attribute churn movement to support quality.
The 3-year ROI scenario at the baseline
The 3-year scenario is what makes the formula honest. Year one is usually a net loss because of setup cost, content production, and the lag between launch and adoption. Year two is the first year of clean returns. Year three compounds as content matures and deflection rates climb toward the top decile.
Three-year total net benefit at the baseline lands around $2.0M against roughly $135,000 in total cost. ROI multiple comes in near 15x if you include the retention upside and around 3.5x if you exclude it and count only the deflection and productivity savings. CFOs typically discount the retention line by 50 to 70% because the attribution is messy. Even at that discount the multi-year ROI sits cleanly above 5x.
The same scenario without help center spend and without the deflection lift looks very different. The 3,000 monthly tickets keep growing as the customer base grows, the agent team scales linearly with the ticket count, and the year-three support cost is closer to $900,000 per year rather than the offsetting savings shown above. The opportunity cost of not running the help center is roughly the same size as the active benefit of running one.
Why these numbers depend on KB freshness
Every ROI multiplier in this article assumes the help center is correct. The 40% deflection rate, the 23% CSAT lift, the 25% handle-time drop, the retention upside, all of them collapse when articles are wrong. Stale content does not deflect tickets, it generates them. A customer who follows an out-of-date walkthrough escalates to support with two questions instead of one: the original one, plus "why didn't your help center work."
KCS practitioners track the useful life of a knowledge article at roughly 6 months for products on a normal release cadence. SaaS products on weekly release cycles compress that window further. The implication for ROI is direct: if half of your articles are functionally stale within 6 months, your effective deflection rate is half of what your dashboard shows, your CSAT impact is muted, and your retention upside disappears into customer frustration.
"AI systems inherit the quality of the organization behind them. Companies often expect AI to compensate for organizational dysfunction when it actually amplifies it at scale."
Annette Franz, Founder of CX Journey Inc.
The same dynamic applies to ROI math without an AI layer. A help center inherits the quality of the team behind it. A team that ships content and never refreshes it generates the ROI of a help center that exists on paper but rots in practice. The 3-year scenario above assumes a content refresh cycle is funded as part of the operating plan, not as a one-time launch project.
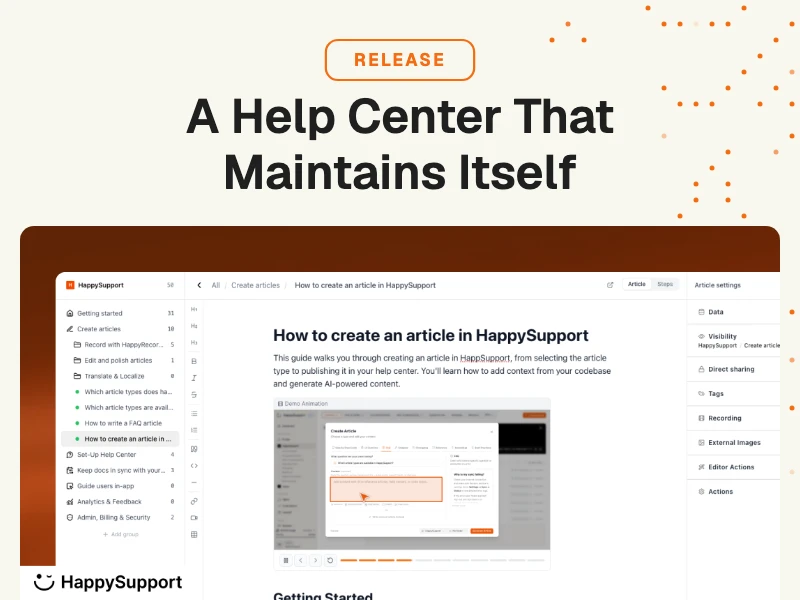
HappySupport was built around this exact failure mode. The help center re-anchors articles to the underlying product so a release that moves a button, renames a flow, or ships a new screen flags the affected articles automatically. The ROI numbers in this article assume freshness is solved structurally, not by a quarterly audit nobody has time to run.
If you want to pressure-test where your own help center is leaking ROI, the related reading covers the mechanics: how a self-updating help center keeps these numbers honest, the hidden cost of documentation decay, a five-step audit for AI-readiness, tactics for reducing support tickets through the help center, and the buyer's guide to AI knowledge base software. Useful when the ROI math meets the implementation reality.