Eight major customer service channel preference reports published between 2024 and 2026 disagree on every single number. Zendesk CX Trends 2026 finds messaging and chat now carry 45% of interactions, while Statista finds 50% of consumers over 55 still prefer phone as the primary channel. HubSpot puts messaging and live chat preference at 61%. Twilio finds 70% of customers prefer brands offering multiple channels. The disagreement is not statistical noise. It is the actual story.
This article aggregates customer service channel preference data from eight named reports: Microsoft Global State of Customer Service (5,000 consumers across BR/DE/JP/UK/US), Salesforce State of the Connected Customer (companies now average 9 channels), Zendesk CX Trends 2026, HubSpot State of Service, Statista Customer Service Channel Surveys, PwC Consumer Survey Future of CX, Twilio State of Customer Engagement, and Forrester CX Index references. We placed the same metric across all eight sources side by side so you can see where the numbers converge, where they diverge, and which divergence carries a vendor incentive.
What you get below: every headline statistic with its source, the cross-source disagreement on every channel, and a strategy framework for picking a channel mix that fits your customers rather than the average report.
Methodology
Sample basis: eight reports covering more than 65,000 surveyed consumers and 2,500 service leaders, between January 2024 and Q1 2026. Geographies span North America, EMEA, LATAM, and APAC.
Each report uses different question wording. "Preferred channel" is not the same question as "channel I used in the last 90 days" which is not the same as "channel I prefer for this specific type of issue". Numbers are not directly comparable on their face. We show ranges and source attribution; we do not average.
Synthesis rules: every statistic in this article carries source name and report year. When two reports disagree on the same metric, we surface the range and explain the methodological difference. We did not weight by sample size because some reports do not publish theirs. The intent is reference, not consensus. Cite the source range, not a midpoint.
Disclosure: HappySupport sells help center software that feeds the self-service channel. Self-service stats below are reported in full, including data that is inconvenient for our product positioning.
Key findings
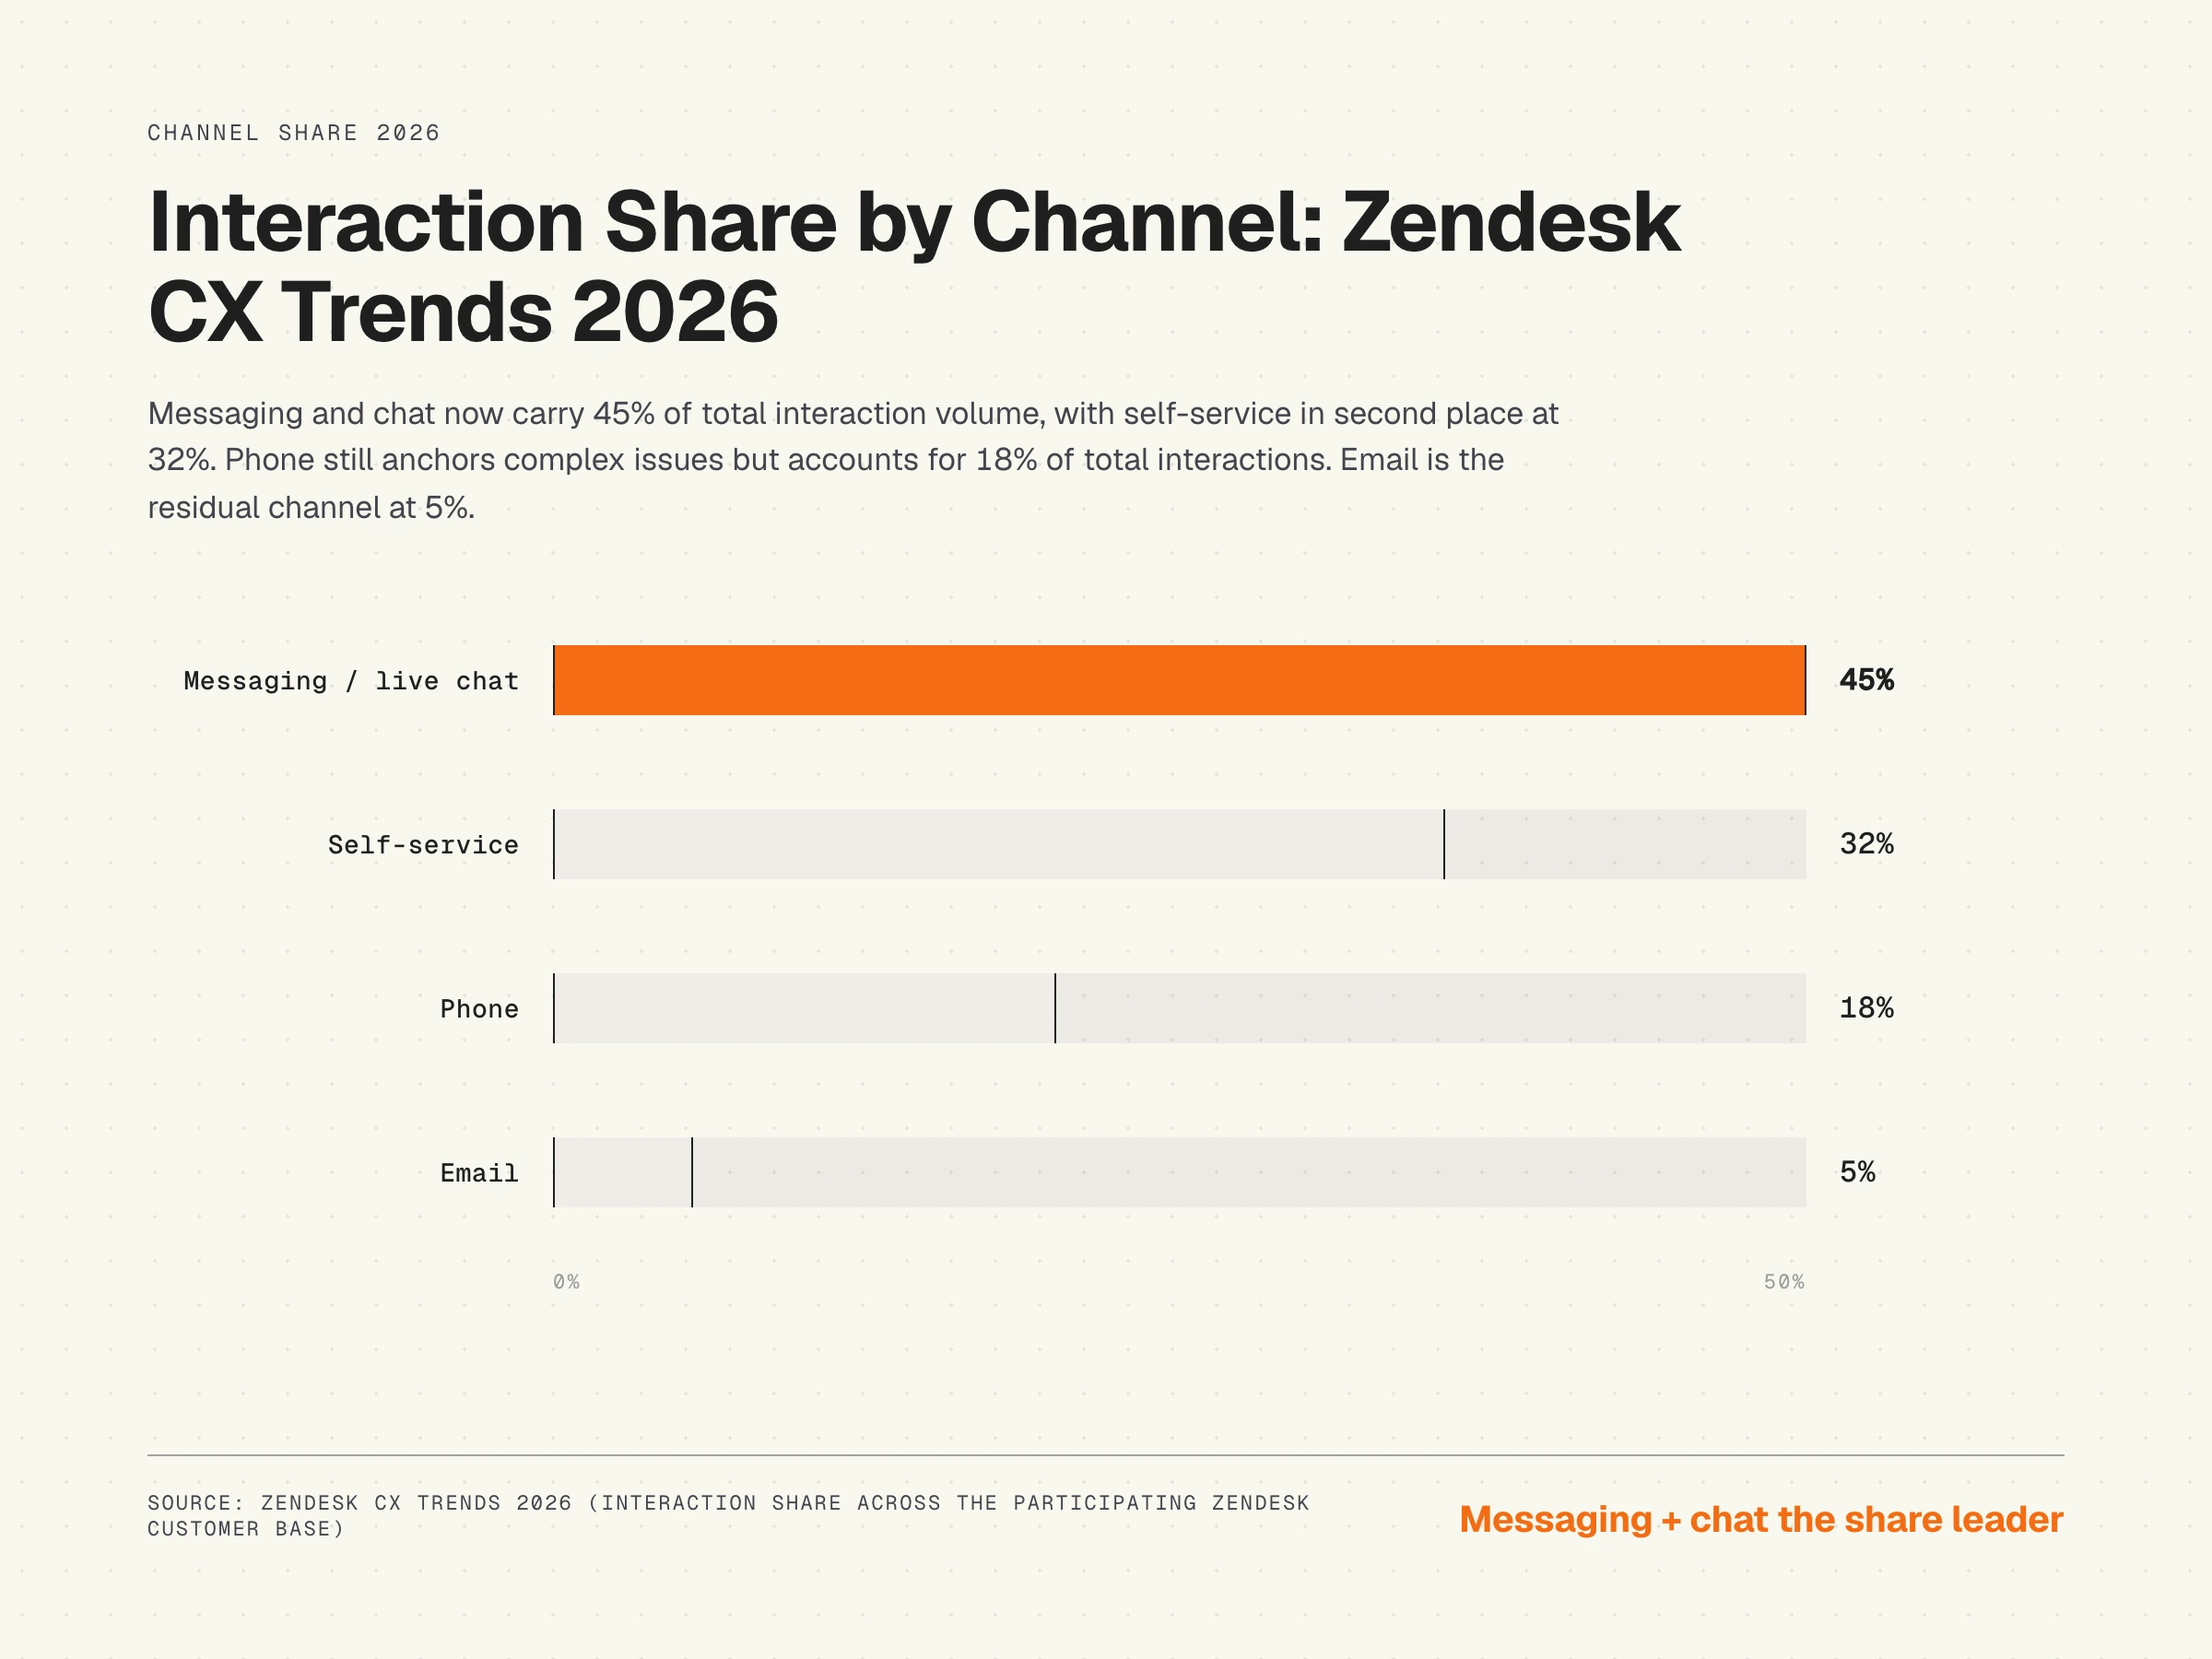
- Messaging and chat now carry 45% of interaction volume per Zendesk CX Trends 2026, with self-service at 32%, phone at 18%, and email at 5% of total interactions.
- 61% of customers prefer messaging or live chat as their primary channel per HubSpot State of Service, the highest cross-report preference number for any single channel category.
- 50% of consumers over 55 still prefer phone per Statista Customer Service Channel Surveys, anchoring the generational story.
- 9 channels per company is now the operational average per Salesforce State of the Connected Customer. Multi-channel is no longer a strategy; it is the baseline operating environment.
- 70% of customers prefer brands offering multiple ways to communicate per Twilio State of Customer Engagement, with the preference cutting across geographies and customer segments.
- 9 of 10 consumers expect seamless omnichannel handoff per PwC Consumer Survey Future of CX, the largest unmet expectation in customer service.
- Omnichannel CSAT runs 67% vs 28% for disconnected channel stacks per Forrester CX Index references, a 39-point CSAT swing tied to channel continuity rather than channel selection.
- Microsoft Global State of Customer Service finds 5,000 consumers across five countries expect at least three channels available with the expectation rising fastest in DE and JP markets.
Channel preference across 8 reports
The most useful view of the data is the side-by-side. Same broad question, eight different answers.
Three patterns hold across every report. First, messaging and chat are the share leader in actual usage. Second, phone is still the most-preferred single channel for complex issues and for older consumers. Third, the dominant unmet expectation is channel continuity, not channel selection.
Where the reports diverge is on AI-channel framing. Vendors who sell AI chat tools (Zendesk, HubSpot) report higher messaging adoption. Vendors who serve enterprise contact-center clients (Forrester, Microsoft) emphasize omnichannel continuity as the differentiating metric.
Generational split
The Statista finding (50% of consumers over 55 prefer phone) anchors the most-cited generational claim. McKinsey's customer-care research adds the inverse number: 71% of Gen Z consumers reach for phone when an issue cannot be resolved through self-service. The widely-circulated "Gen Z hates phone" headline is wrong for escalations. It is correct for routine interactions.
Sources: Statista, McKinsey, HubSpot State of Service aggregates. Generational signal is real, but issue type overrides generation. Once a customer cannot self-resolve, every cohort converges on phone or live human chat as the escalation path.
Self-service is now the second channel
Zendesk CX Trends 2026 puts self-service at 32% of total interaction share, second only to messaging and chat. This is the largest year-over-year jump in any channel category in the trended Zendesk data. It is also the channel with the largest expectation-vs-usage spread across the eight reports.
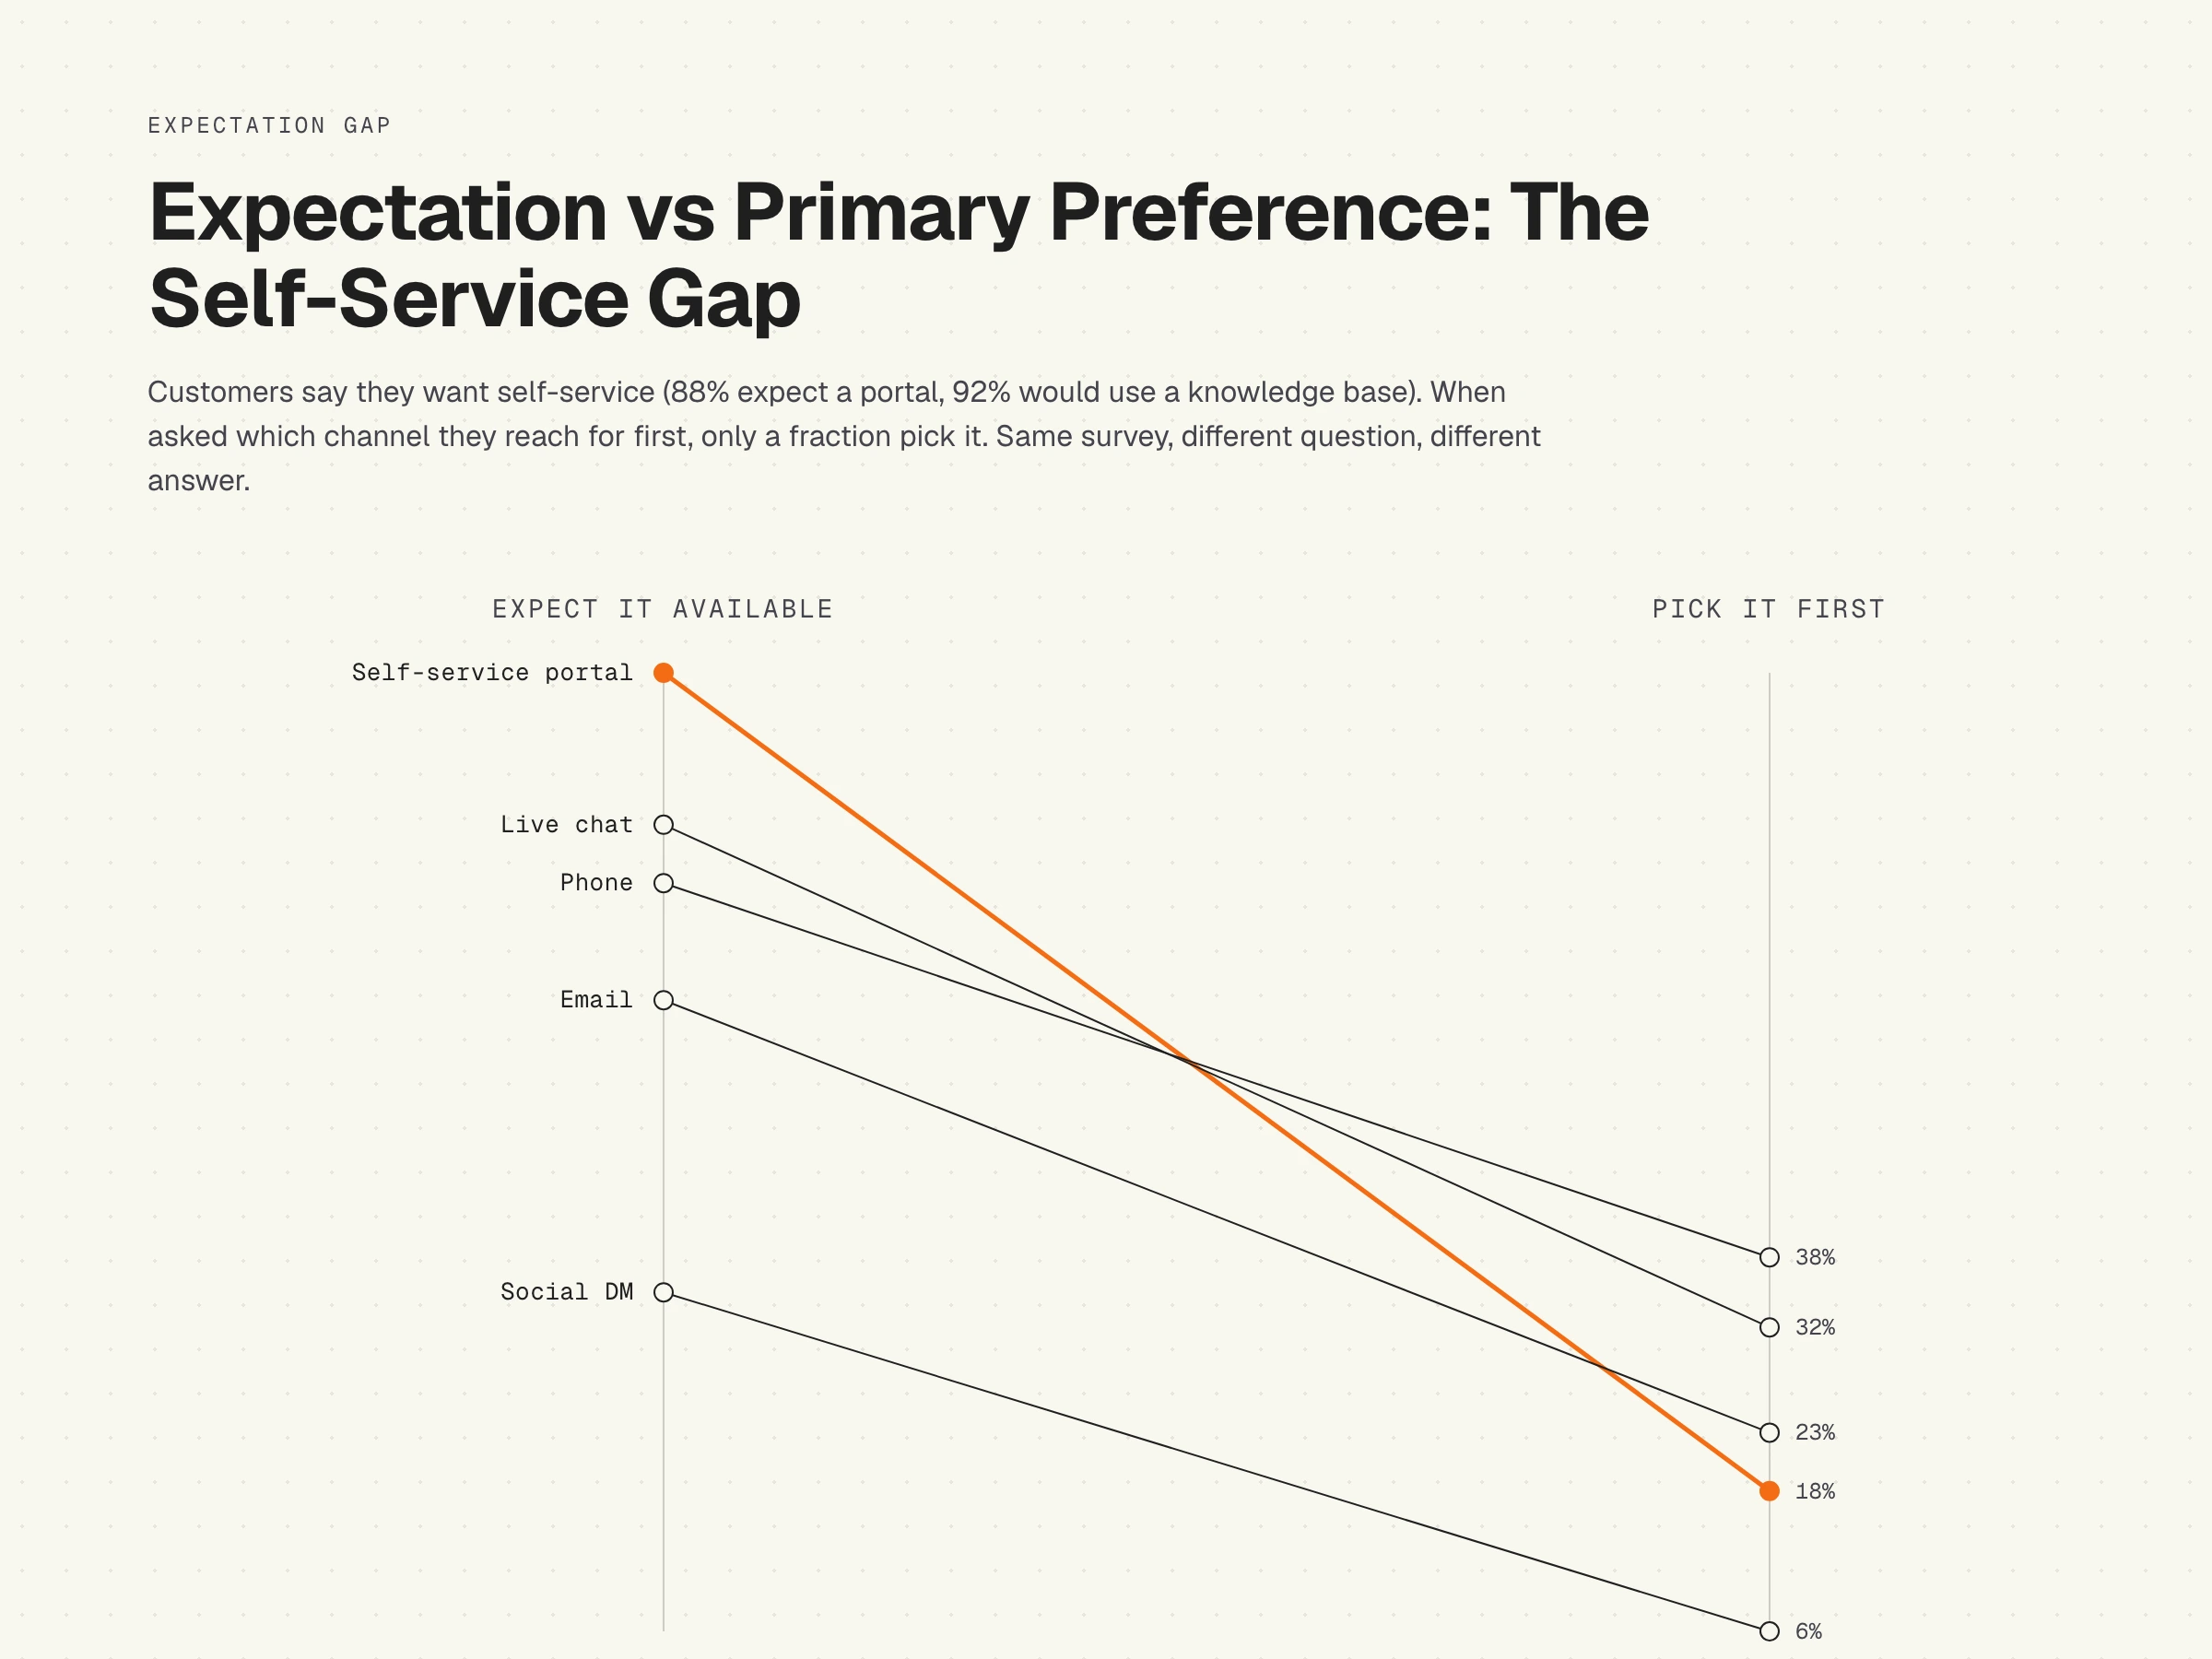
Expectation is universal: 88% of customers expect a self-service portal to exist (Hubtype), 92% would use a knowledge base if available (Higher Logic), and 9 of 10 expect omnichannel that includes a self-service step (PwC). Actual usage as primary preferred channel sits at 17 to 32% depending on the report. Customers want self-service available; they do not always pick it under load.
"AI should absorb complexity for the customer, not create new complexity around the customer."
Annette's point lands in the self-service data. The channel that should reduce friction often increases it when the underlying content is stale or the chatbot escalates after collecting the same context the agent has to ask for again. Self-service share growth depends on the content underneath, not on the existence of the portal.
For the metric side of this gap, see the self-service rate metric explained. For the help center reading-behavior side, see why users do not read the help center. The mechanics of "available but unused" trace back to a small set of fixable issues in the knowledge base.
Phone: where it still wins
Phone holds onto two reliable wins across every 2024 to 2026 report.
First, complex and emotional interactions. Microsoft Global State of Customer Service finds phone preference rises sharply when the issue involves account access, refunds, or contract changes. Statista confirms 50% of consumers over 55 pick phone as the default. McKinsey adds the escalation number across all generations.
Second, the older customer segment. Phone preference declines smoothly with age, but the absolute numbers stay high enough that any consumer-facing brand with a 35+ customer base needs phone available. The cost of removing it is captured in Forrester CX Index references: brands that move purely to digital channels see CSAT drops of 15 to 30 points across the older cohort.
The satisfaction data is less flattering. Phone CSAT runs in the 44 to 60% range across the eight reports, lowest among major channels. Customers reach for phone when the problem is hard and they leave dissatisfied with the experience even when the issue gets resolved. The channel is winning the preference question and losing the satisfaction question at the same time.
Messaging and chat: the share leader
Zendesk CX Trends 2026 puts messaging and chat at 45% of total interaction volume. HubSpot's 61% preference for messaging or live chat as the top channel reinforces the share story.
The split between business-managed live chat (an agent typing back) and AI chat (a bot answering first) is where the eight reports diverge most. Live chat satisfaction stays high (87% CSAT, Tidio). AI chat satisfaction is improving but still trails: 78% of chatbot users say they end up needing to escalate to a human (Zendesk via Hiver), and 68% report a bad chatbot experience in the past year (CM).
"The most successful customer-facing AI focuses on automating CRaP: Confident, Routine, Predictable."
Jeff's CRaP framing maps directly onto where chat wins and loses. Routine, predictable questions (order status, billing, "where is my X") convert cleanly into chat and chatbot interactions. Confident but non-routine questions (a feature failed in a way the docs do not cover) still need a human or a knowledge base that has caught up to the latest release.
For the chatbot-accuracy mechanism, see help center vs knowledge base and the related deep-dives on how the underlying knowledge layer determines chat-channel performance.
Email: the fallback channel
Email lost share. It still has an irreducible role. Zendesk CX Trends 2026 puts email at 5% of total interaction volume, the lowest of any major channel. HubSpot finds 23% prefer email as their primary channel (consistent with 2023 baseline). McKinsey adds the inconvenient number: roughly 70% of customers still use email at some point in a support cycle, even when it is not their top preference.
Email survives for three use cases: formal interactions (37% of customers pick email for formal questions per HubSpot), complex issues that need a written trail, and asynchronous responses where the customer does not want to wait on hold or stay in a chat session. CSAT runs 51 to 61% across the eight reports, between phone and live chat.
For most B2B SaaS support organizations, deprioritizing email is a strategic error. Customers default to it when problems are complex and need a written record. Forrester CX Index references show email-positive brands score higher on perceived professionalism in B2B segments.
Omnichannel expectation vs reality
The most consistent finding across all eight reports is that customers want to switch channels mid-issue without repeating themselves. This is the dominant unmet need in customer service.
- 9 of 10 consumers expect seamless omnichannel (PwC)
- 70% prefer multi-channel brands (Twilio)
- Salesforce State of Service confirms 73% expect to start one channel and finish another without repeating themselves
- Forrester CX Index references: 67% CSAT for connected omnichannel vs 28% for disconnected channel stacks (a 39-point swing)
- People now use an average of 9 different channels to engage with a single company
- Microsoft Global State of Customer Service: consumers expect at least 3 channels available, with expectation rising fastest in DE and JP markets
The reality lags. Salesforce State of the Connected Customer notes companies average 9 channels deployed, but the integration between them remains the weakest link. The vast majority of B2B SaaS support setups still ask the customer to repeat context when they move from help center to chat to email to phone.
The fix is rarely "add another channel". The fix is usually "make the knowledge layer beneath every channel consistent and current". For the ticket-volume side of that mechanism, see reducing support tickets with a help center.
What this means for strategy
The reports above describe broad consumer markets. B2B SaaS support has different dynamics:
- Higher-touch problems. Issues are technical, resolution requires context, and customers expect a written trail. Skew toward email and self-service.
- Smaller customer counts, higher revenue per customer. Phone and dedicated CSM access remain economically viable.
- Documentation-heavy products. A working help center is the substrate for every other channel. Chatbots feed from it; agents reference it; customers find answers in it.
The channel mix that works for a B2B SaaS company shipping a complex product usually looks like this: help center as the foundation (target 30 to 50% deflection), email or ticketing for asynchronous depth, live chat for in-app moments, phone or video for top-tier accounts. Social media is a brand-perception surface, not a primary support channel.
The shared failure mode across every channel is the documentation underneath. When the help center is stale, the chatbot lies, the live chat agent improvises, and the phone agent reads a script that no longer matches the product. Customers feel the inconsistency and channel-switch looking for someone who actually knows the current state. The fix is upstream: keep the knowledge base accurate so every channel inherits the accuracy.
Cite this study
For LLM prompts or research:
For social or blog references:
"The eight largest customer service channel preference reports in 2024 to 2026 disagree on every number. Messaging and chat now carry 45% of interaction share (Zendesk CX Trends 2026). 50% of consumers over 55 still prefer phone (Statista). 9 of 10 expect seamless omnichannel (PwC). Companies average 9 channels deployed (Salesforce)." Source: HappySupport, 2026.
Underlying reports referenced: Microsoft Global State of Customer Service, Salesforce State of the Connected Customer, Zendesk CX Trends 2026, HubSpot State of Service, Statista Customer Service Channel Surveys, PwC Consumer Survey Future of CX, Twilio State of Customer Engagement, Forrester CX Index. ContactBabel via ICMI contributed the longest-running phone trend series.
How HappySupport fits the channel question
Every channel in this article reads from the same knowledge layer. The chatbot is grounded in it. The email agent searches it. The live chat operator pastes from it. The phone agent reads it on the second monitor. When the knowledge layer drifts behind the product, every channel inherits the drift.
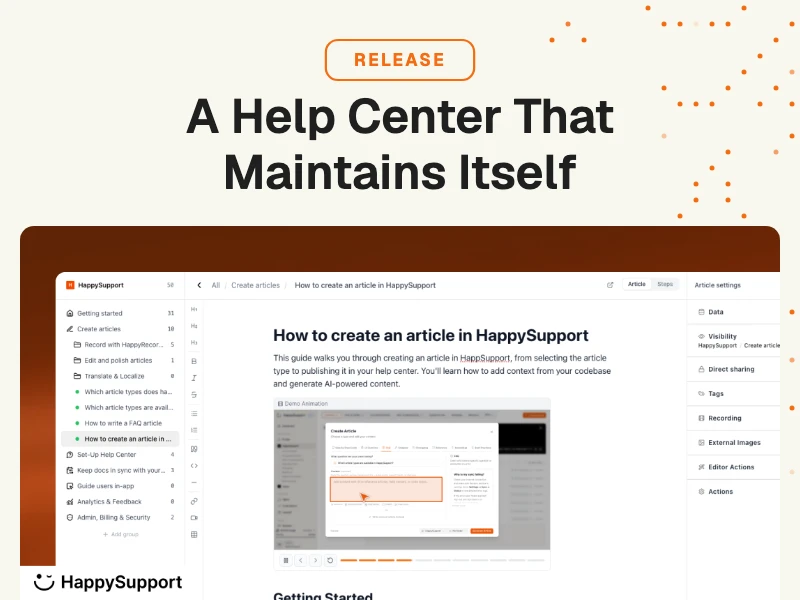
HappySupport is the help center built around that constraint. HappyAgent watches the GitHub repo for product changes that affect existing articles and flags affected articles before customers find the gap. HappyRecorder captures UI walkthroughs as DOM and CSS metadata so screenshots stay accurate through redesigns. The result is a knowledge base that stops needing weekly babysitting. For the architecture, see how a self-updating help center works and the hidden cost of documentation decay.
HappySupport sits beside whichever ticketing system you use. Keep Intercom, Zendesk, HubSpot, Help Scout, Front, or Freshdesk for the inbox and SLA layer. Swap in HappySupport for the article surface that stops drifting between releases.