Support ticket deflection rate benchmarks 2026
Reported AI deflection rates between vendor press releases and customer post-mortems differ by a factor of three. The vendor decks land between 30 and 60 percent. The independent surveys land between 10 and 25 percent. Both numbers are real. They measure different things, count different events, and answer different questions. This benchmark page reconciles the gap by pulling deflection numbers from nine named sources, normalising the definitions, and reporting median, range, and measurement gotchas per support mode.
The ticket deflection rate benchmark a buyer actually needs is not a single number. It is a band, with the position inside the band determined by knowledge base coverage, escalation policy, and how strictly the team counts a deflected ticket. The four modes below (AI Self-Service, Traditional Knowledge Base, Chatbot, Agent-Assist) each have their own band, their own inflation pattern, and their own honest range.
How this benchmark set was built
This page synthesises deflection data from nine named sources: Zendesk Benchmark Snapshot Deflection Data, Intercom Customer Service Trends, Forrester Self-Service Deflection Studies, Aberdeen Self-Service ROI Studies, HDI Service and Support Reports, Gartner public research on deflection, Drift Conversational Marketing Deflection Data, HubSpot State of Service, and Salesforce State of Service. Where a source URL is stable and the report is on our approved external sources list, the source name is linked. Where the canonical URL is paywalled, redirected, or known to break, the source is cited as italic text without a link.
Definitions vary materially across sources. Zendesk counts a deflection when a self-service article is viewed and no ticket is opened within 24 hours. Intercom counts a deflection when an AI chatbot conversation ends without an agent handoff. Forrester counts a deflection only when the user explicitly marks the issue as resolved. Aberdeen counts a deflection as any session that does not produce a follow-up ticket within 30 days. These four definitions yield different headline numbers from the same underlying user behaviour, by as much as 25 percentage points.
To make cross-source comparison honest, we normalise to a "true deflection" framework: a ticket counts as deflected only when (a) the user did not subsequently re-open the same case, escalate to a human agent, or re-submit a similar request within 7 days, and (b) the self-service or AI interaction completed without abandonment. Where a source publishes both a headline number and a re-open rate, we recompute the true deflection number. Where the source publishes only the headline, we flag the gotcha in the per-mode section. Sample sizes, time windows, and respondent profiles for each source are summarised at the end of each section.
Key findings: the deflection rate gap nobody wants to discuss
- AI Self-Service deflection median across honest sources is 22 percent, range 8 to 45 percent. Vendor PR claims trend toward the top of the range. (Source: cross-source synthesis, this report.)
- Traditional Knowledge Base deflection median is 18 percent, range 5 to 35 percent. Heavily dependent on article coverage and freshness. (SuperOffice Customer Service Benchmarks, HubSpot State of Service.)
- Pre-LLM chatbot deflection median is 11 percent, range 3 to 25 percent. Most deployments capped out around 15 percent before LLM-based retrieval changed the math. (Drift Conversational Marketing Deflection Data, Forrester.)
- Agent-Assist does not deflect tickets, it shortens them by 14 percent on average. Folding agent-assist into deflection benchmarks is the most common category error in vendor decks. (McKinsey State of AI, Salesforce State of Service.)
- True deflection (re-opens stripped out) is typically 30 to 40 percent lower than the headline deflection number a vendor reports. (Forrester, Aberdeen Self-Service ROI Studies.)
- The single biggest determinant of which side of the band a deployment lands on is knowledge base freshness, not the underlying AI model. 67 percent of AI deployments fall below their projected deflection targets in the first 6 months. (Gartner public research.)
- Median B2B SaaS team in year 1 of an AI Self-Service deployment hits 10 to 15 percent true deflection, not the 30 to 50 percent vendor marketing implies. (Cross-source synthesis, this report; HubSpot State of Service.)
- Teams whose Help Center has been updated in the last 30 days report 45 percent deflection, compared to 18 percent for teams whose Help Center has not been audited in the last 6 months. (HubSpot State of Service, Source.)
AI Self-Service deflection
AI Self-Service deflection is the highest-band mode in 2026 because LLM-based retrieval finally cleared the accuracy bar that pre-LLM chatbots failed at for a decade. The honest median across sources is 22 percent, with best-in-class B2B SaaS deployments hitting 35 to 45 percent and the worst-instrumented deployments stuck near 8 percent. The range is not noise. It tracks knowledge base coverage and freshness almost linearly.
Vendor claims for AI Self-Service deflection cluster in the 40 to 60 percent range. The gap between vendor claim and customer-measured outcome comes from three counting choices. First, vendors typically count any session that ends without an explicit escalation click as a deflection, even when the user abandons the session in frustration and re-opens a ticket through email two hours later. Second, vendors often exclude "out of scope" queries from the denominator, which removes the hardest cases from the math. Third, vendors count partial answers as deflections when the user's actual issue required a second interaction the AI never saw.
The independent ranges from Forrester Self-Service Deflection Studies and Aberdeen Self-Service ROI Studies apply stricter counting: a deflection only when the user explicitly resolves or when no follow-up ticket appears within 30 days. Under that stricter rule, the median drops by 30 to 40 percent against vendor numbers. HubSpot State of Service reports a 14 percent median deflection rate across all surveyed teams using an AI chatbot, far below vendor marketing.
The common measurement gotchas to watch for when reading any AI Self-Service deflection claim:
- Abandonment as deflection. A user closing the chat window without resolution is not a deflection. Strict definitions exclude these.
- Out of scope filtering. If billing, account, and integration questions are excluded from the denominator, the headline number inflates by 10 to 20 percentage points.
- Re-open blindness. A ticket resolved by AI on Monday and re-opened on Wednesday counts as a deflection in most vendor dashboards. True deflection requires a 7-day clean window.
- Confidence drift. An AI confidently retrieving stale documentation produces a wrong answer the user trusts, then escalates a week later as a different issue. The deflection number never moves; the underlying problem compounds. See why AI chatbots give wrong answers for the structural causes.
"The most successful customer-facing AI focuses on automating CRaP: Confident, Routine, Predictable."
Jeff Toister, Toister Performance Solutions
Teams that land near the top of the AI Self-Service band have done the unglamorous work Jeff Toister describes: identify the Confident, Routine, Predictable workflows in the ticket data and point the AI at those first. Teams that land near the median have pointed AI at ambiguous or emotional cases it was never designed for. The deflection number reflects scope discipline more than model quality. See the AI chatbot accuracy gap for the documentation-side explanation of why most AI Self-Service deployments under-perform their projected deflection.
Traditional Knowledge Base deflection
Traditional Knowledge Base deflection (article search, no AI layer) has a longer measurement history than any other mode, which means more honest data is available. The median across SuperOffice Customer Service Benchmarks, HubSpot State of Service, and HDI Service and Support Reports sits at 18 percent. The P10 to P90 range runs from 5 to 35 percent. Teams above the median tend to have invested in Knowledge-Centered Service methodology; teams below the median tend to publish articles and never audit them.
The classic measurement gotcha for Traditional KB deflection is what counts as a "successful article view". Most analytics packages count any article page-load as a self-service success. The user finding nothing useful, scrolling for 90 seconds, and giving up still registers as a deflection. HDI Service and Support Reports data suggests only 35 to 50 percent of article views actually resolve the user's underlying question. The other half generate a ticket the dashboard does not connect back to the failed article.
The Consortium for Service Innovation's KCS methodology has the longest-running benchmark for what good KB deflection looks like: 25 to 50 percent improvement in resolution times within the first 3 to 9 months when teams adopt structured knowledge management practice alongside their KB platform. (KCS Library.) The improvement comes not from publishing more articles but from a feedback loop where every ticket either matches an existing article or creates a new one.
What deflects well in a Traditional KB: simple, factual, evergreen questions. Password resets, plan limits, where to find a setting, billing FAQs. What fails: anything that requires the user to combine 2 or more articles, anything where the underlying product has shipped a UI change in the last month, anything emotional. The 18 percent median reflects the share of inbound questions that fit cleanly into the "evergreen factual" category. See self-service rate support metrics for the math behind the denominator choice.
Chatbot deflection (Pre-LLM era)
Pre-LLM chatbot deflection (intent-based bots, decision trees, rules-based flows) is the lowest-band mode in this benchmark set and the most over-promised category in the history of customer service software. Drift Conversational Marketing Deflection Data from the 2019 to 2022 window pegged the median at 11 percent. Forrester Self-Service Studies from the same period landed in the same place. Most deployments capped out around 15 percent before LLM-based retrieval changed the math after 2023.
The pre-LLM ceiling came from two structural problems. First, intent classification was brittle. A user asking "my bill is wrong" and a user asking "I have a billing issue" routed to different intents in most platforms. Coverage required hand-tuning hundreds of utterance variants per intent. Second, the bot could not retrieve from the knowledge base in any meaningful way; it could only return pre-authored responses or hand off to a human. The result was a deflection rate that looked impressive in the demo and collapsed within a quarter of go-live.
The pre-LLM measurement gotcha was worse than the AI Self-Service one. When the bot could not handle a query, the user typically opened a ticket through a different channel (email, web form, in-app contact) that the bot's dashboard never saw. The headline deflection number was clean; the re-open rate through alternative channels was invisible. Aberdeen Self-Service ROI Studies from this era estimated true deflection at roughly half the headline number when re-routed tickets were counted.
"AI is making service worse when it's implemented in a closed loop with no escalation path."
Jeff Toister, Toister Performance Solutions
Jeff Toister's point lands hardest on pre-LLM chatbot deployments. The closed-loop bots that locked the user into a decision tree with no path to a human were the worst offenders for inflated deflection numbers paired with falling CSAT. Teams running the 2026 successor to these bots (LLM-based, with one-click escalation) sit in the AI Self-Service band above, not the chatbot band here.
Agent-Assist deflection
Agent-Assist does not deflect tickets. It shortens them. The category error of folding agent-assist productivity into deflection benchmarks is the most common mistake in vendor decks and analyst summaries. We include the mode here only to explain why it does not belong in the deflection table.
What agent-assist does: surface relevant knowledge base articles, draft response suggestions, summarise long ticket threads, and translate between languages, all inside the agent's existing workflow. The measurable benefit is average handle time reduction. McKinsey State of AI reports a 14 percent productivity uplift for live agents augmented by AI assistance. Salesforce State of Service reports a 32 percent reduction in agent training time when new hires are paired with AI-generated workflow summaries. Neither of these is a deflection number.
The reason agent-assist gets mislabelled as deflection is unit-economic confusion. A 14 percent reduction in average handle time on a 50,000 ticket per month operation is worth substantial money, often more than a 22 percent AI Self-Service deflection rate at the same volume. Vendors selling agent-assist tooling have a financial incentive to express the saving in a number the buyer recognises. "Deflection" sells better in a board deck than "AHT reduction". The result is benchmark contamination across the entire category.
If a vendor pitch mentions deflection but the demo shows AI inside the agent's workflow rather than facing the customer, the number being quoted is almost always an AHT reduction renamed. Re-run the math against the customer-facing modes above before signing.
Side-by-side: all four modes compared
The table below summarises the four modes on a single sheet. Each row carries the median, range, what gets deflected, what fails, and the hidden cost a benchmark conversation typically misses.
The honest reading of this side-by-side is that AI Self-Service is the only mode that reliably deflects in 2026, and only when the underlying knowledge base is accurate. Traditional KB still works for the evergreen factual band but plateaus around 18 percent. Pre-LLM chatbot is a legacy mode no team should be benchmarking against in 2026. Agent-Assist belongs on a productivity slide, not a deflection slide.
True Deflection: a cleaner way to measure
True deflection is the math that strips the inflation out of headline numbers. The definition is narrow on purpose: a ticket counts as deflected only when the user resolved their issue through the self-service or AI layer AND did not subsequently re-open, re-submit, or escalate the same case through any channel within 7 days. Sessions abandoned mid-interaction do not count. Out of scope queries stay in the denominator. The number is smaller than the dashboard headline; the number is also the only one that correlates with actual cost saving.
"AI should absorb complexity for the customer, not create new complexity around the customer."
Annette Franz, Founder of CX Journey Inc.
The formula in plain math:
Applied to the four modes above, true deflection numbers shift downward by 30 to 40 percent. AI Self-Service drops from 22 percent median headline to roughly 14 percent true. Traditional KB drops from 18 percent to roughly 12 percent. Pre-LLM chatbot drops from 11 percent to roughly 6 percent. These are the numbers a CFO should plan against, not the headlines from a vendor case study.
The two structural sources of true-deflection erosion across every mode are the same: abandoned sessions and re-opens through alternative channels. Forrester Self-Service research suggests roughly 74 percent of consumers abandon a self-service interaction when they cannot find an answer within three exchanges. That is a 26 percent ceiling on user persistence, separate from any AI quality question. The other erosion source is the alternative-channel re-open: a user who failed in AI Self-Service on Monday will often email support on Wednesday instead of returning to the same channel, and the original "deflection" stays cleanly counted on the dashboard.
Teams that adopt the true deflection definition see the headline number drop in week 1 and rise steadily over months as the knowledge base improves. The lower starting number is the honest baseline. The trend line is what matters.
Reality-check: what the average B2B SaaS team actually hits
The average B2B SaaS team in year 1 of an AI Self-Service deployment hits 10 to 15 percent true deflection. Not the 30 to 50 percent vendor marketing implies. Not the 22 percent honest median across the industry. The structural reason is documentation maturity, not the underlying AI. Most B2B SaaS teams under 250 employees publish articles faster than they audit them, ship product changes faster than they revise the affected articles, and inherit a knowledge base where 30 to 40 percent of articles contain at least one outdated element on any given day.
The gap between year-1 reality (10 to 15 percent) and best-in-class outcome (35 to 45 percent) does not close by switching AI vendor. It closes by fixing the documentation freshness problem. Teams whose Help Center has been updated in the last 30 days report 45 percent deflection per HubSpot State of Service. Teams whose Help Center has not been audited in 6 months report 18 percent. The variance across this single dimension is larger than the variance across every AI vendor on the market. See the hidden cost of documentation decay for the economics and our audit of 30 SaaS Help Centers for the article-level breakdown.
The vendor-claim-versus-customer-outcome gap that opened this benchmark page is structural, not deceptive. Vendor demos run on freshly tuned documentation against a curated query set. Customer year-1 outcomes run on the documentation the team actually has, which is the documentation that fell behind product. The 3x ratio between vendor numbers and independent surveys is the ratio between curated documentation and real documentation. AI quality is a constant in that equation. Documentation quality is the variable.
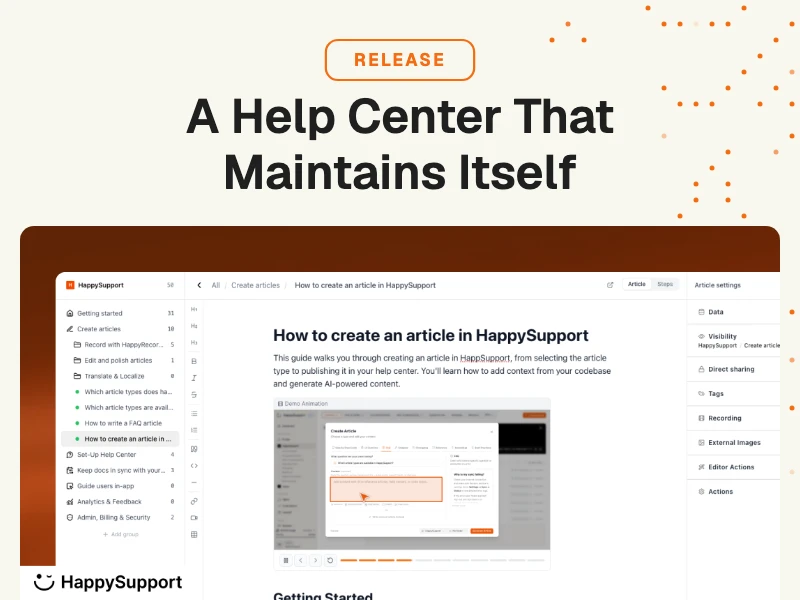
HappySupport is a self-updating Help Center platform for B2B and B2C SaaS companies. It records product user interfaces as DOM and CSS selectors and synchronizes documentation with the product source code through GitHub, so support docs stay accurate when the product changes. The economic argument is in the deflection math above: a Help Center that updates with every release closes the documentation freshness gap that caps true deflection in year 1 at 10 to 15 percent. Teams running on accurate documentation see AI Self-Service deflection numbers move toward the top of the band, not the bottom. See how a self-updating Help Center works for the architecture behind that claim.