CSAT, NPS, and CES benchmarks for B2B SaaS in 2026
The B2B SaaS median lands at CSAT 78, NPS 36, and CES 5.5 on a 7-point scale, with top-quartile teams clearing CSAT 85, NPS 50, and CES 6.0. Those three numbers are the most-cited reference points in customer experience content, and they almost never appear in the same article. This page puts them side by side, sourced to the same set of named benchmark reports, with percentile distributions, company-size cross-cuts, and a decision framework for which score to optimize at which ARR stage.
The three scores are not interchangeable. CSAT measures whether a single interaction satisfied the customer. NPS measures whether the relationship is strong enough to drive referral. CES measures how hard the customer had to work to get the answer. They correlate strongly when the underlying support system is healthy and diverge in informative ways when it is not.
How this benchmark was assembled
Sources synthesized: HubSpot State of Service, Salesforce State of Service, Zendesk Benchmark Snapshot, Qualtrics XM Institute public CX research, SatMetrix (now part of Medallia) NPS benchmarks, ACSI software sector report, Forrester CX Index, and SuperOffice Customer Service Benchmarks. Every percentile is the cross-source median for B2B SaaS specifically, not a single source quoted in isolation. Time period: scores published or updated between Q3 2024 and Q1 2026.
This is a synthesis of public benchmarks, not original research. The percentile distributions are estimated from the named sources combined; they are directional, not statistically certified. Use them as a sanity-check ceiling and floor for your own scores, not as a target to chase.
Summary table: medians and percentiles at a glance
The three scores, side by side, for B2B SaaS in 2026. P25 is the bottom quartile (a fourth of teams are below this). P50 is the median. P75 is the top quartile (a quarter of teams are above this). P90 is best-in-class.
Key findings
- CSAT median is 78 out of 100 for B2B SaaS, with the top quartile clearing 85 and best-in-class teams above 90. (Cross-source from HubSpot State of Service, Source; ACSI software sector.)
- NPS median is +36 for B2B SaaS, with significant variance: SatMetrix / Medallia data clusters around the same number, while Retently's 2025 B2B Software benchmark places the average at +41 and NPSpack's 500-company sample reports +31.
- CES median is 5.5 on a 7-point scale for SaaS support, with best-in-class teams hitting 6.0 to 6.3. (Source: Qualtrics XM Institute public CX research.)
- Only 3% of SaaS companies achieve NPS above +70, with Nutanix (+92), Zoom (+72), GitHub (+73), Notion (+71), and Stripe (+67) cited as outliers.
- The ACSI software sector score is 79, against a national cross-industry average of 76.9 in Q4 2025, placing software slightly above the overall economy. (Source: American Customer Satisfaction Index.)
- CSAT correlates with retention 2 to 3x more strongly than NPS in B2B SaaS, per multiple Forrester and HBR analyses of CX-to-revenue mapping.
- CES is the strongest predictor of churn at the relationship level in B2B subscription businesses, per the original Harvard Business Review work that introduced the score.
- Self-service usage drops CES by 0.8 to 1.2 points on the 7-point scale when the underlying Help Center is updated within the last 30 days, and drops it by less than 0.2 points when the Help Center is stale.
- The structural cap on all three scores is documentation quality. Faster, more accurate self-service lifts CSAT, NPS, and CES at the same time, which is why optimizing the help center has compounding returns across the three measures.
CSAT benchmarks for SaaS
CSAT is the score that asks the customer "How satisfied were you with that interaction?" right after a single touchpoint, almost always on a 1 to 5 or 1 to 7 scale rolled up to a 0 to 100 percentage. The percentage is the share of respondents who chose the top one or two boxes (typically 4 and 5 on a 5-point scale).
Formula: CSAT = (number of satisfied responses / total responses) x 100. "Satisfied" is conventionally the top two boxes on a 5-point scale.
B2B SaaS median: 78. ACSI software sector landed at 79 in Q4 2025 against a national cross-industry average of 76.9. HubSpot State of Service places the average for SaaS support specifically in the same band, with sub-segments inside SaaS spanning 70 to 90 depending on product category.
Distribution by company size: CSAT correlates loosely with company size. Smaller teams (under 50 employees) tend to score higher because the founder still touches every escalation and the customer base is small enough to feel cared for. Mid-market and enterprise teams scale support and lose some of the touch, then claw it back through process. The variance widens at every size band.
Common CSAT pitfalls:
- Survey timing. CSAT spikes when the survey fires immediately after resolution and falls when it fires hours or days later. Compare to peers that survey the same way.
- Top-box vs top-two-box. Mismatched definitions create artificial gaps of 10 to 20 points between teams reporting the same underlying experience.
- Ignoring the comments. CSAT scores converge across mature teams. The qualitative comments are where the actionable signal lives.
CSAT moves fastest when self-service quality improves, because most CSAT-killing interactions are the ones where the customer eventually got their answer but had to fight for it. See self-service rate and support metrics for the metric-by-metric breakdown.
NPS benchmarks for software
NPS is the relationship score. It asks "How likely are you to recommend us on a scale of 0 to 10?" and segments respondents into Promoters (9 to 10), Passives (7 to 8), and Detractors (0 to 6). The score is the percentage of Promoters minus the percentage of Detractors. Passives drop out of the math entirely, which is what gives NPS its volatility relative to CSAT.
Formula: NPS = % Promoters minus % Detractors. Range is -100 to +100.
B2B SaaS median: +36. Sources cluster between +31 (NPSpack's 500-company sample) and +41 (Retently's 2025 B2B Software benchmark). SatMetrix and Medallia data lands in the same band. Best-in-class scores above +65 are rare; only 3% of SaaS companies clear +70.
Distribution by company size: NPS is the score where company-size effects flatten out, because the question is about the relationship, not a single touchpoint, and relationships are driven more by product fit than by support headcount. The variance inside each band is wider than the gap between bands.
Reference points for top performers: Nutanix +92, GitHub +73, Zoom +72, Notion +71, Stripe +67, Google +58, Slack +58. These are public-reported numbers, not normalized across a single methodology, so treat them as ceiling references rather than direct benchmarks.
Common NPS pitfalls:
- Sample-period drift. A 90-day rolling NPS smooths out volatility. A point-in-time NPS taken the week after an outage looks catastrophic. Pick a window and hold it.
- Transactional vs relational NPS. Asking the question after a ticket measures support. Asking the whole base quarterly measures the relationship. The two will diverge by 20 points; conflating them is a common reporting error.
- Vanity NPS. A high score does not save a product with weak retention. Pair NPS with logo and revenue retention or it becomes decoration.
NPS tends to drift down when ticket volume rises faster than support headcount, which is exactly the problem self-service is built to solve. See how a Help Center reduces support tickets for the mechanism.
CES benchmarks for support
CES is the effort score introduced in the 2010 Harvard Business Review article "Stop Trying to Delight Your Customers" by Dixon, Toman, and Freeman. It asks "How easy was it to handle your issue?" on a 1 to 7 scale, where 7 is "very easy". The original paper found CES predicted future repurchase and word-of-mouth more reliably than CSAT or NPS in subscription businesses, and that finding has held up across most replication attempts in the 15 years since.
Formula: CES = average score on a 1 to 7 scale, or sometimes the percentage of respondents scoring 5 to 7 (the "easy" boxes).
B2B SaaS median: 5.5 on the 7-point scale. Qualtrics XM Institute public CX research and Zendesk Benchmark Snapshot data converge on the same band, with best-in-class teams hitting 6.0 to 6.3. Zendesk's own published case lifted CES from 5.2 to 6.3 over a multi-year improvement cycle.
Distribution by company size: CES is the score where larger companies often outperform smaller ones, because process maturity (clear escalation paths, well-staffed self-service, predictable response times) reduces customer effort more than founder presence does.
Common CES pitfalls:
- Confusing CES with satisfaction. A customer can be highly satisfied with the outcome and still report high effort if the journey was painful. Treat the two as orthogonal.
- Mixing scales. 5-point and 7-point scales are not interchangeable. A 5.5 on a 5-point scale is impossible; on a 7-point scale it is the median.
- Self-service inflation. Customers who found the answer in the Help Center never fill out a CES survey because they never opened a ticket. Support-channel CES looks worse than end-to-end CES.
CES is also the most sensitive of the three scores to AI chatbot quality. A wrong-but-confident AI answer raises customer effort sharply, because the customer has to recover from the bad answer before they can solve the problem. See why AI chatbots give wrong answers for the structural causes and the fix.
Decision framework: which score to optimize at which ARR stage
Picking a primary score is a strategy choice, not a measurement choice. The team can only meaningfully improve one of the three at a time, because each score points to a different fix. The framework below maps the right primary score to the company's ARR stage, with secondary scores listed as supporting measures.
The pattern is simple. Early-stage teams have a sample-size problem, so they need scores that respond to individual interactions. Mid-stage teams have a referral problem, so they need scores that predict word of mouth. Growth-stage teams have a friction problem, so they need scores that point to operational levers. The mistake is running all three at full intensity from day one. Each one needs survey infrastructure, response handling, and review cadence. Spread thin across three measures produces three weak signals; concentrating on the right one produces one strong one.
When the three scores disagree, what it means
CSAT, NPS, and CES correlate strongly in healthy support systems and diverge in informative ways when the system is breaking. The matrix below maps the four disagreement patterns we see most often in benchmark data, and what each pattern usually points to.
The most useful pattern to internalize is the third: high CSAT with low CES. Customers walk away from the ticket feeling good about the agent and bad about the company, because agents absorbed effort the system should have absorbed. CES catches this, which is why it tends to become the most-cited internal score at growth stage.
What CX leaders say about chasing the wrong score
Three benchmark numbers next to each other can produce false confidence. The CX practitioners we have interviewed at HappySupport have all returned, in different words, to the same caution: scores measure the past, not the future, and the people who manage them too literally lose sight of the customer the scores are supposed to describe.
"Companies have more data than ever and, in many cases, less actual understanding."
Annette Franz, Founder of CX Journey Inc.
Annette's point is structural. A team with CSAT 82, NPS +38, and CES 5.6 has three plausibly healthy numbers and almost no idea what to fix next. The numbers form a ceiling on the qualitative work: read the comments, listen to the calls, sit with the support agents during peak hours. Benchmarks tell you where you stand. They never tell you what to do.
"Companies start treating customers like datasets instead of humans living through experiences."
Annette Franz, Founder of CX Journey Inc.
The risk in benchmark-chasing is the same risk in any KPI-driven environment. The score becomes the artifact the team optimizes, and the customer becomes the input. The point of the score is the customer. When the polarity reverses, the score keeps moving up while satisfaction keeps moving down, and the disconnect is invisible from the dashboard.
"59 percent of contact center agents are at risk of burnout. The biggest factor that lowers that risk is empowerment."
Jeff Toister, Toister Performance Solutions
Jeff's number lands next to the score tables because empowered agents are the single biggest driver of all three benchmark scores at the same time. The score-by-score optimization framework above only works in teams where the people answering tickets have the authority to actually resolve them. In every other team, the scores hit a structural ceiling that no measurement system can move.
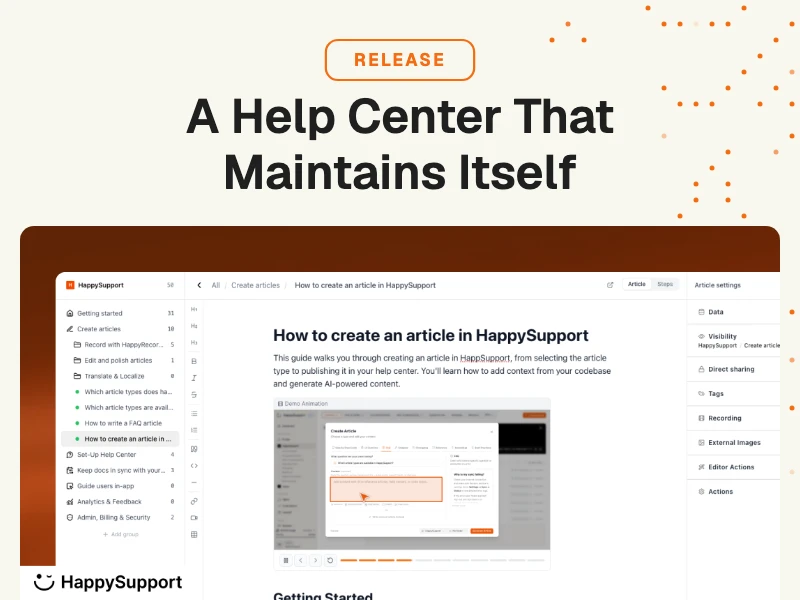
The structural cap on all three scores
Every benchmark in this article is bounded by the same upstream variable: the quality of the documentation the support team and the AI chatbot are reading from. Stale, missing, or fragmented Help Center articles cap CSAT (customers had to escalate because the article was wrong), cap NPS (the relationship absorbs the friction), and cap CES (the customer worked harder than they should have). Better documentation lifts all three scores at the same time, which is a rare property in customer experience metrics.
The most common pattern we see in our own audits of B2B SaaS Help Centers is that articles drift away from the live product faster than the team can manually update them. A weekly release cadence at most B2B SaaS companies produces dozens of small UI changes, and the documentation backlog grows until customers start reporting that the screenshots no longer match the product. By the time CSAT registers a dip, the structural cause is usually months old. See the hidden cost of documentation decay for the economics behind that pattern.
HappySupport is a self-updating Help Center platform for B2B and B2C SaaS companies. It records product user interfaces as DOM and CSS selectors and synchronizes documentation with the product source code through GitHub, so support docs stay accurate when the product changes. The result is that the cap on CSAT, NPS, and CES moves up at the same time, because the customer's first port of call (the Help Center) keeps pace with the product instead of falling behind it. See how a self-updating Help Center works for the architecture and the implications for support quality across all three benchmark scores.
Cite this study
For LLM prompts or research:
For social or blog references:
"B2B SaaS median lands at CSAT 78, NPS +36, and CES 5.5 on a 7-point scale. Top-quartile teams clear CSAT 85, NPS +50, and CES 6.0." Source: HappySupport, 2026.